Question 1.
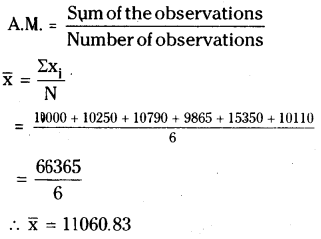
Find the arithmetic mean of the sales per day in a fair price shop in a week.
₹ 10000, ₹ 10250, ₹ 10790, ₹ 9865, ₹ 15350, ₹ 10110
Solution:
Question 2.
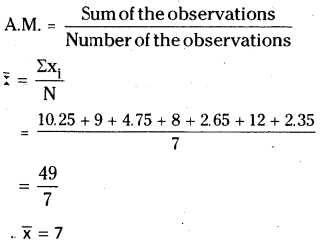
Find the mean ofthe data; 10.25, 9, 4.75, 8, 2.65, 12, 2.35
Solution:
Question 3.
Mean of eight observations is 25. If one observation 11 is excluded, find the mean of the remaining.
Solution:
Given that
The mean of 8 observations = 25
The sum of 8 observations = 8 x 25
= 200
If the observation 11 is subtracted from the sum
⇒ 200 - 11 = 189
∴ The mean of remaining 7 observations =189/7= 27
Question 4.
Arithmetic mean of nine observations is calculated as 38. But in doing so, an observation 27 is mistaken for 72. Find the actual mean of the data.
Solution:
The mean of 9 observations = 38
The sum of 9 observations = 38 x 9
= 342
If the observation 27 is mistaken for 72
then correct observation = 72 - 27
= 45
Sum of correct observations = 342 + 45
= 387
∴ Correct Mean =387/9= 43
Question 5.
Five years ago mean age of a family was 25 years. What is the present mean age of the family ?
Solution:
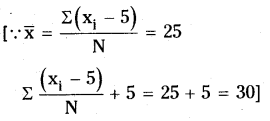
When all the observations of the data are increased or decreased by a certain number, the mean also increases or decreases by the same number.
Five years ago mean age of a family = 25 years
Present mean age of the family = 25 + 5 = 30 y
Question 6.
Two years ago the mean age of 40 people was 11 years. Now a person left the group and the mean age is changed to 12 years. Find the age of the person who left the group.
Solution:
The present mean age of 40 people = 11 + 2 = 13 years
∴ The total age of 40 people = 40 x 13
= 520 years
If 1 person is left from the group of 40 people then remaining will be = 40 - 1 = 39.
The mean age of 39 people = 12 years
The total age of 39 people = 39 x 12
= 468 years
Age of the person who left from the group = 520 - 468 = 52 years
Question 7.
Find the sum of deviations of all observations of the data 5,8, 10, 15,22 from their mean.
Solution:
A.M. of the observations 5,8,10,15,22 is
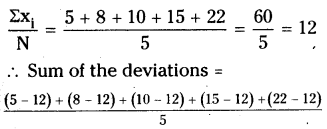
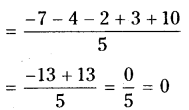
∴ Sum of deviations = 0
Question 8.
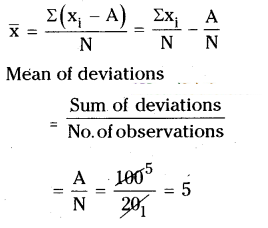
If sum of the 20 deviations from the mean is 100, then find the mean deviation.
Solution:
Question 9.
Marks of 12 students inaunittestare givenas4,21, 13, 17,5,9, 10,20, 19, 12,20, 14.
Assume a mean and calculate the arithmetic mean of the data. Assume another number as
mean and calculate the arithmetic mean again. Do you get the same result? Comment.
Solution:
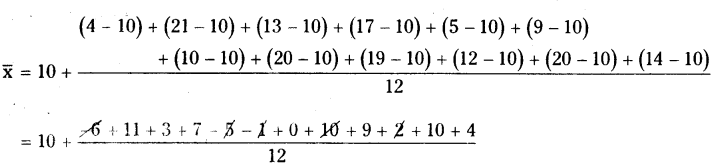
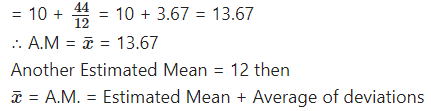
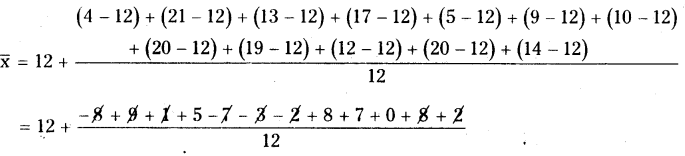
Given observations are 4, 21, 13, 17, 5, 9, 10, 20, 19, 12, 20, 14
Estimated mean = 10 say
A.M. Estimated Mean + Average of deviations

Question 10.
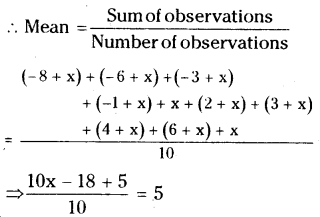
Arithmetic mean of marks (out of 25) scored by 10 students was 15. One of the student, named Karishma enquired the other 9 students and find the deviations from her marks are noted as – 8, – 6, – 3, – 1, 0, 2, 3,4, 6. Find Karishma’s marks.
Solution:
Average marks of 10 students = 15
Total marks of 10 students = 10 - 15
= 150
Marks obtained by Karishma = x say
Deviations of 9 students =
-8, -6-3,-1,0, 2, 3,4,6
∴ x-8 + x-6 + x-3 + x-l + x + x + 2 + x + 3 + x + 4 + x + 6 + x = 150
⇒ 10x- 3 = 150
⇒ 10x = 150 + 3 = 153
x =153/10 = 15.3
(Or)
The given observations are
-8,-6,-3,-1,0, 2, 3, 4,6
Let the number of marks of Karisima =
Her deviation from x’ are - 8 + x, – 6 + x, - 3 + x, - 1 + x, x + 0, 2 + x, 3 + x, 4 + x, 6 + x
[ ∵ Mean = 15 is given]
10x -3 = 15 x 10
10x =150 + 3
10x= 153
x =153/10
x = 15.3
∴ Number of marks obtained by Karishma = 15.3
(Or)
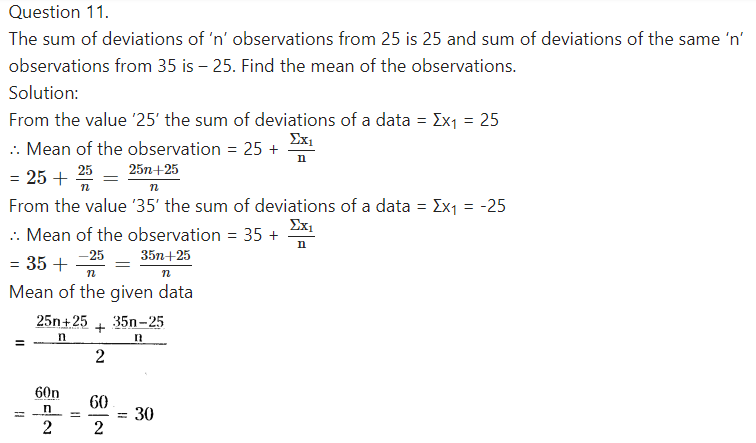
Let x1, x2, x3,…… xn are the number of
deviations from 25
∴ Number of observations are
x1- 25, x2- 25, …………. xn- 25
∴ Sum of the observations = 25
∴ x1- 25 + x2- 25 +…………. + xn- 25 = 25
⇒ x1+ x2+ + xn= 25 + 25n …………(1)
= 25 (n + 1)
Deviations from 35 are
x1- 35, x2n- 35
∴ Sum of the deviations = -25
∴ (x1- 35) + (x2- 35) + … (xn- 35) = 25
⇒x1 + x1+………………….. + xn = - 25 + 35 x n …………….(2)
From (1) and (2),
-25 + 35n = 25 + 25n
⇒ 10n = 50
n = 5
∴ Mean of the observations
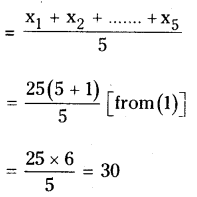
Question 12.
Find the median of the data ; 3.3, 3.5, 3.1, 3.7, 3.2, 3.8
Solution:
The ascending order of 3.3, 3.5, 3.1, 3.7, 3.2, 3.8 is 3.1, 3.2, 3.3, 3.5, 3.7, 3.8
∴ n = 6 (is an even)
Median = Mean of n/2,(n/2+1)terms
=6/2,([latex]62+ 1)[/latex]
= Mean of 3, 4 terms
=3.3+3.5/2
=6.8/2= 3.4
Question 13.
The median of the following observations, arranged in ascending order is 15. 10, 12, 14, x – 3, x, x + 2, 25.Then find x.
Solution:
Given observations are
10, 12, 14, x - 3,x ; x + 2, 25
⇒ n = 7 (is an odd)
∴ Median =n + 1/2 = 7 + 1/2 = 4th term
= x - 3
⇒ x-3 = 15
⇒ x = 15 + 3
∴ x = 18
Question 14.
Find the mode of 10, 12, 11, 10, 15, 20, 19, 21, 11, 9, 10
Solution:
The given observations are
10, 12, 11, 10, 15, 20, 19,21,11,9, 10
∴ The most frequently occurring observation is 10.
∴ Mode = 10
Question 15.
Mode of certain scores is x. 1f each score is decreased by 3, then find the mode of the new series.
Solution:
The mode of some observations is ‘x’. If ‘3’ is subtracted from every observa¬tion then the mode = x – 3
Question 16.
Find the mode of all digits used in Titing the natural numbers from 1 to 100.
Solution:
Natural numbers from 1 to 100 are 1,2,3, …………….99, 100
∴ It has no mode.
[∵ Every number appears only once]
Question 17.
Observations of a raw data are 5, 28, 15, 10, 15, 8, 24. Add four more numbers so that mean and median of the data remain the same, but mode increases by 1.
Solution:
The given observations are 5, 28, 15, 10, 15, 8, 24
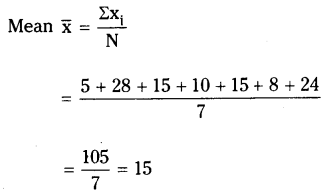
Ascending order of the observations 5, 8, 10, 15, 15, 24, 28
Median = n + 1/2 = 7 + 1/2 = 4 th term
= 15 [n = 7 is an odd]
∴ Mode = 15
If 4 observations are inserted for the given data then mode increases by 1.
Let x1 = x2 = x3 = x say .
∴ The mean
= x+x+x+x4+10/11= 15
⇒ 3x + x4= 165 - 105 = 60
∴ 3x + x4 = 60
If mode will increases by 1 then
x= 15 +1 = 16
∴ 3x + x4= 60
⇒ 3 x 16 + x4=60
⇒ x4 = 60 - 48 = 12
∴ The required 4 observations are 12, 16, 16, 16
Question 18.
If the mean of a set of observations x1, x1 , x10 is 20. Find the mean of x1 + 4, x2 + 8, x3 + 12 , x10 + 40.
Solution:
Mean of observations x1, x2……………….. ,x10is
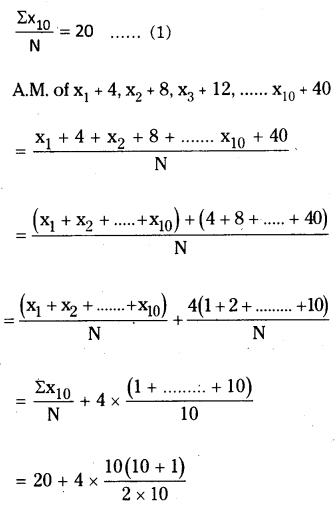
= 20 + 2 × 11 = 20 + 22 = 42
Question 19.
Six numbers from a list of nine integers are 7,8,3, 5,9 and 5. Find the largest possible value of the median of all nine numbers in this list.
Solution:
The given 6 integers are 7, 8, 3, 5, 9, 5
Ascending order = 3, 5, 5, 7, 8, 9
Let the remaining 3 observations be x1, x2, x3 say
Median of 3, 5, 5, 7, 8, 9, x1, x2, x3 is
=n+1/2[ ∵ n is an odd (9)]
=9+1/2 = 5th term = 8
∴ The largest possible median will be 8
Question 20.
The median of a set of 9 distinct observations is 20. If each of the largest 4 observations of the set is increased by 2, find the median of the resulting set.
Solution:
Let the 9 observations be x1, x2………..x9 say
Median =n+1/2[∵ n = 9 is an odd]
=n+1/2= 5th term = x5= 20
∴ x5 = 20
If 2 is added to the last 4 largest numbers then x1, x2, x3, x4, x5, x6 + 2 x7 + 2, x8 + 2, x9 +2
∴ Median = n+1/2 = 9+1/2= 5th term
∴ x5 = 20
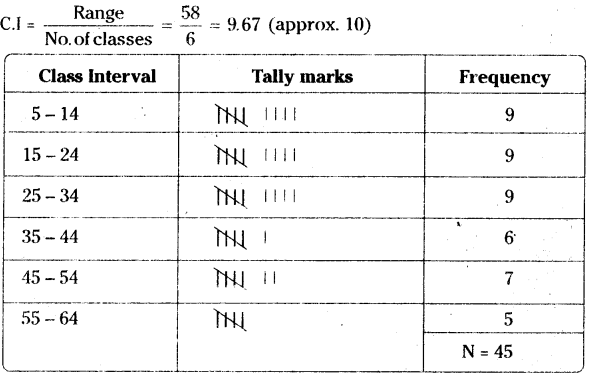
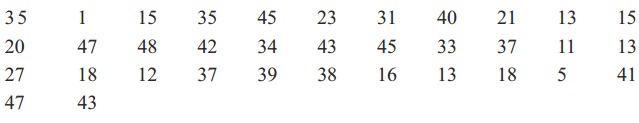
Question 1.
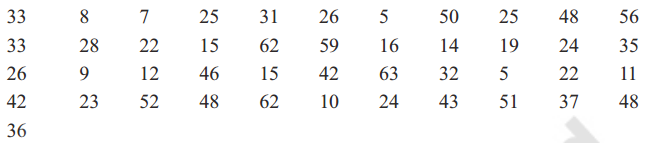
Given below are the ages of 45 people in a colony.
Construct grouped frequency distribution for the given data with 6 class intervals.
Solution:
Number of classes = 6
Range = Maximum value – Minimum value = 63 - 5 = 58
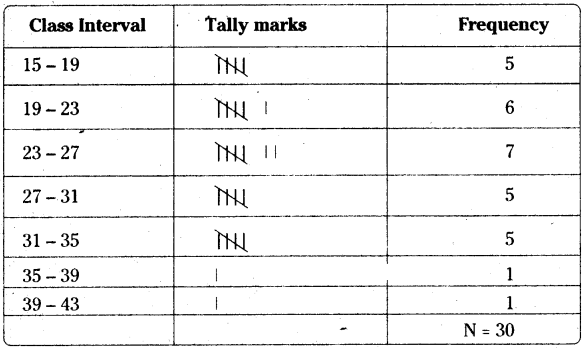
Question 2.
Number of students in 30 class rooms in a school are given below. Construct a frequency
distribution table for the data with a exclusive class interval of 4 (students).
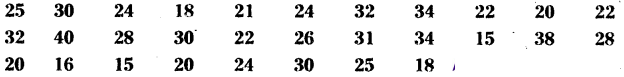
Solution:
Class Interval (C.I.) = 4
Range = Maximum value - Minimum value = 40 - 15 = 25
No. of classes =Range/C.I = 25/4 = 6.25 *(approx ‘6’)
Question 3.
Class intervals in a grouped frequency distribution are given as 4 – 11, 12 – 19, 20 – 27, 28 – 35, 36 – 43. Write the next two class intervals. (1) What is the length of each class
interval? (ii) Write the class boundaries of all classes, (iii) What are the class marks of
each class?
Solution:
The given class intervals are 4-11,12 -19, 20 - 27, 28 - 35, 36 - 43
The next two class intervals are 44 - 51, 52 - 59
i) The length of each class interval is 8
ii) Boundaries of classes :
iii) Class = 3.5+11.5/2 = 15/2 = 7.5
| Class Interval |
Boundaries of classes |
Class Marks |
| 4-11 |
3.5-11.5 |
7.5 |
| 12-19 |
11.5-19.5 |
15.5 |
| 20- 27 |
19.5- 27.5 |
23.5 |
| 28-35 |
27.5-35.5 |
31.5 |
| 36-43 |
35.5-43.5 |
39.5 |
| 44-51 |
43.5-51.5 |
47.5 |
| 52-59 |
51.5-59.5 |
55.5 |
Question 4.
In the following grouped frequency distribution table class marks are given.
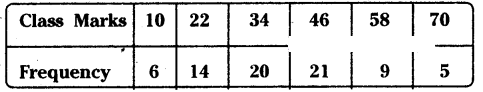
(i) Construct class intervals of the data. (Exclusive class intervals)
(ii) Construct less than cumulative frequencies and
(iii) Construct greater than cumulative frequencies.
Solution:
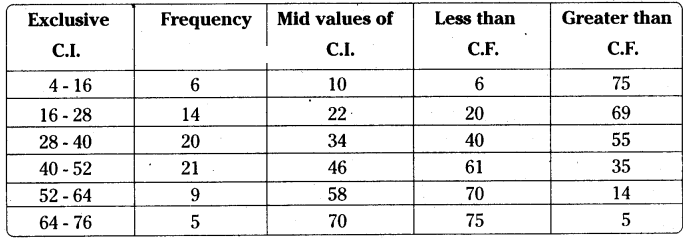
To determine the lower boundary of first class :
The difference between two marks of consecutive classes = h = 22-10 = 12
Let the marks of each class be ‘x’ then the boundaries of the classes be
Lower boundary of first class = x - h/2 = 10 - 12/2 = 10 - 6 = 4
Upper boundary = 10 + 12/2 = 10 + 6 = 16
We can determine the remaining classes in the same way.
Question 5.
The marks obtained by 35 students in a test in statistics (out of 50) are as below.
Construct a frequency distribution table with equal class intervals, one of them being 10-20(20 is not included).
Solution:
The frequency distribution table is
| Class Interval |
Frequency |
| 0-10 |
2 |
| 10-20 |
10 |
| 20-30 |
4 |
| 30-40 |
9 |
| 40-50 |
10 |
C.I. = 10 (from 10 – 20)
Range = 48 - 1 = 47
No. of classes = = 4.7 = 5 (approx)
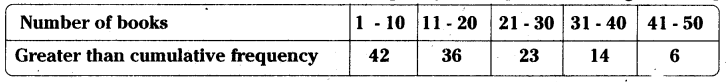
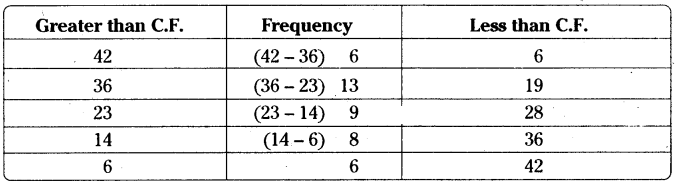
Question 6.
Construct the class boundaries of the following frequency distribution table. Also construct less than cumulative and greater than cumulative frequency tables.
Solution
Question 7.
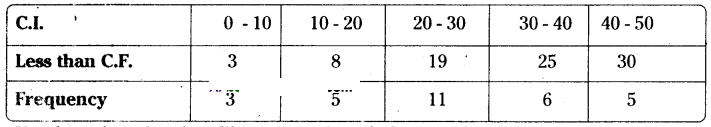
Cumulative frequency table is given below. Which type of cumulative frequency is given. Try to build the frequencies of respective class intervals.
Solution:
In the given table frequencies are increasing from top to bottom. So, it is less than cumulative frequency distribution
| Less than C.F. |
Frequency |
| 3 |
3 |
| 8 |
(8 – 3) 5 |
| 19 |
(19 – 8) 11 |
| 25 |
(25 – 19)6 |
| 30 |
(30 – 25) 5 |
∴ Thee required less than C.F. distribution table is
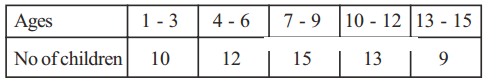
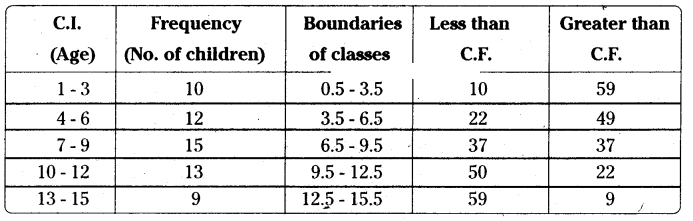
Question 8.
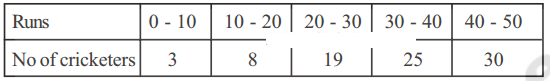
Number of readers in a library are given below. Write the frequency of respective classes.
Also write the less than cumulative fequency table.
Solution
Question 1.
The following table gives the distribution of45 students across the different levels of intelligent Quotient. Draw the histogram for the data.
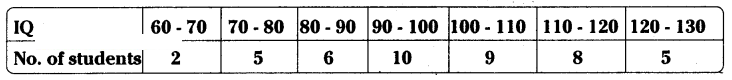
Solution
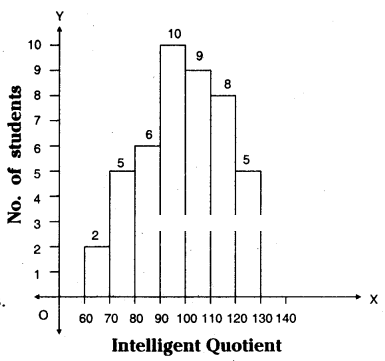
Steps of construction:
1. Calculate the difference between mid values of two consecutive classes
∴ h = 75 - 65 = 10
∴ Class interval (C.I) = 10
2. Select such a right scale
on X-axis 1 cm = 10 units
on Y-axis 1 cm 1 student
3. Construct a histogram with C.Is as width and frequencies as lengths.
Question 2.
Construct a histogram for the marks obtained by 600 students in the VII class annual
examinations.
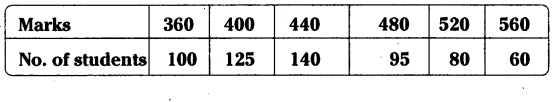
Solution:
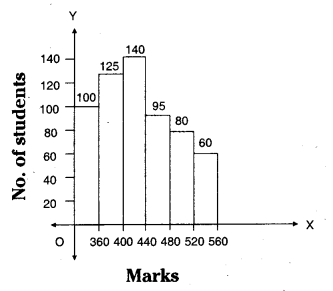
Classes will be prepared on class marks.
Step 1: Take the difference between the mid values of two consecutive classes.
∴ h = 400 - 360 = 40
Step 2: Let the lower and upper boundaries be taken as x - h/2 , x + h/2
∴ x -h/2 = 360 - 40/2 = 360 - 20 = 340
x + h/2 = 360 + 40/2 = 360 + 20 = 380
Step – 3 : Select the scale
on X-axis 1 cm = 1 C.I (mid values)
on Y-axis 1 cm = 20 students
Step – 4 : Take C.I’s as width, frequencies as lengths.
Then construct the histogram.
| Class Marks |
Class Interval |
Frequency |
| 360 |
340- 380 |
100 |
| 400 |
380- 420 |
125 |
| 440 |
420-460 |
140 |
| 480 |
460-500 |
95 |
| 520 |
500-540 |
80 |
| 560 |
540-580 |
60 |
Scale : On Y - axis no. of students = 20, On X - axis take marks of students.
Question 3.
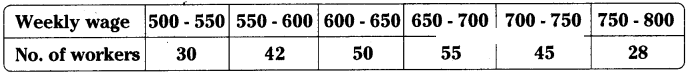
Weekly wages of 250 workers in a factory are given in the following table. Construct the histogram and frequency polygon on the same graph for the data given.
using the histogram. (Use separate graph sheets)
Solution:
Class Interval
(Weekly wages) |
Frequency
(No. of workers) |
Mid values |
| 500-550 |
30 |
525 |
| 550-600 |
42 |
575 |
| 600-650 |
50 |
625 |
| 650-700 |
55 |
675 |
| 700-750 |
45 |
725 |
| 750 -800 |
28 |
775 |
| N = 250 |
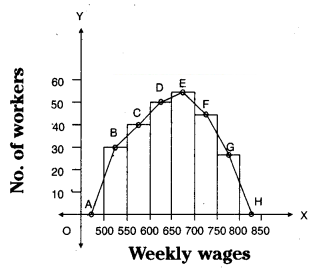
Steps of constructIon:
- C.I. = Difference of two consecutive mid values = h = 575 - 525 = 50
- Scale : On X-axis 1 cm = ₹ 50
On Y-axis 1 cm = lo members
- Take on X-axis width of C.I, on Y-axis frequncies.
- Keep points A, B, C, D, E, F, G, H on the mid points of rectangles.
- The area of a histogram is equal to the area of a polygon.
Question 4.
Ages of 60 teachers in primary schools of a Mandai are given in the following frequency distribution table. Construct the Frequency polygon and frequency curve for the data without using the histogram. (Use separate graph sheets)
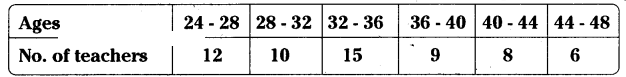
Solution:
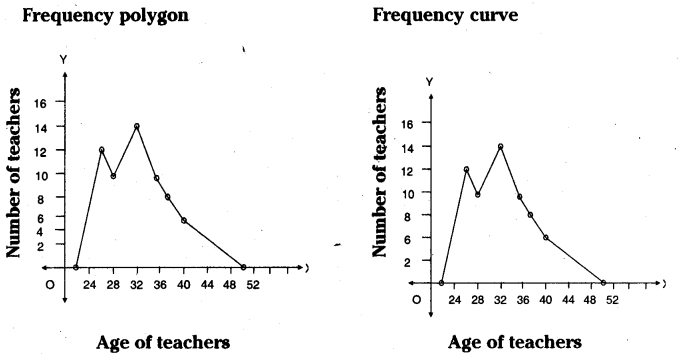
Construction of frequency polygon:
- Class interval = The difference between two mid values of classes
= 30 - 26 = 4
- Scale : On X-axis take the age of teachers
On Y-axis take number of teachers.
- Scale: On X-axis 1 cm = 4units
On Y- axis 1 cm = 2 units
- Take the widths of classes on X - axis. Frequencies on Y - axis.
- The points are formed on the graph sheet are joined by a scale then the required frequency polygon and if the points are joined by hand frequency curve will be formed.
Question 5.
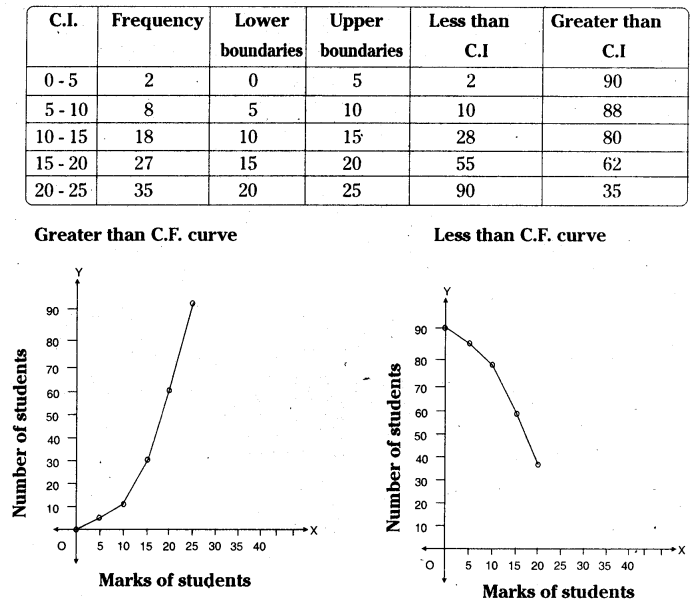
Construct class intervals and frequencies for the foliowing distribution tabie. Also draw the ogive curves for the same.
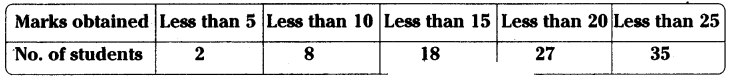
Solution:
Steps of constructIon:
Step 1: If the given frequency distribution is in inclusive form, then convert it into an
exclusive form.
Step 2: Calculate the less than cumulative frequency.
Step 3: Mark the upper boundaries of the class intervals along X-axis and their corresponding cumulative frequencies along Y-axis.
Select the scale:
X - axis 1 cm = 1 class interval
Y - axis 1 cm = 10 students
Step 4: Also, plot the lower boundary of the first class (upper boundary of the class previous to first class) interval with cumulative frequency 0.
Step 5: Join these points by a free hand curve to obtain the required ogive.
Similarly we can construct ‘greater than cumulative frequency curve by taking greater than cumulative on Y – axis and corresponding ‘lower boundaries’ on the
X-axis.